
How to Monitor Your SaaS Projects: Uptime, Revenue, and Dependencies in One View
Managing SaaS projects often feels overwhelming when uptime, revenue, and dependencies are scattered across multiple tools. A unified dashboard simplifies this by bringing everything into one place, saving time, reducing errors, and helping you focus on growth. Here's the key takeaway:
- Why it matters: Enterprises use an average of 106 SaaS apps, and context switching between tools can waste over an hour per incident. A single dashboard cuts this inefficiency.
- What to do: Consolidate uptime monitoring, revenue tracking, and dependency scanning into one view. Tools like Bax integrate with platforms like GitHub, Stripe, and Vercel to streamline this process.
- Key benefits: Centralized alerts, reduced costs, and faster decision-making. Organizations can save up to 25% on software costs and improve productivity by eliminating scattered tools.
Review Your Current Monitoring Setup
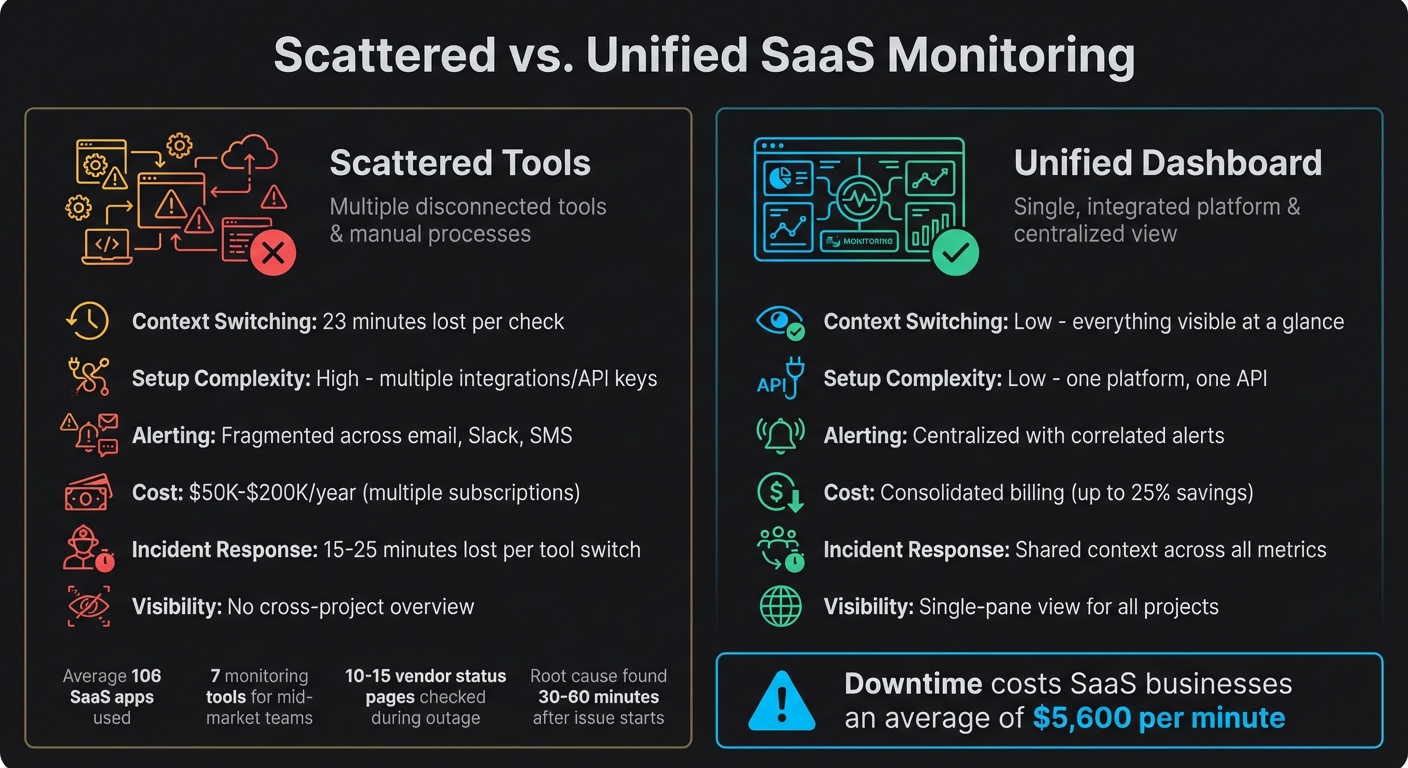
Scattered vs Unified SaaS Monitoring: Cost and Efficiency Comparison
Unified monitoring is key to streamlining workflows and cutting down on lost productivity. Before diving into building a unified dashboard, take a step back and evaluate your current monitoring tools. Many indie developers and small teams rely on a patchwork of unsynchronized tools - one for uptime checks, another for payment tracking, and yet another for dependency monitoring (like GitHub's Dependabot alerts). This scattered setup often creates a "Rube Goldberg machine" of webhooks and API tokens that can fail silently[5].
Consider this: as of 2025, organizations use an average of 106 SaaS apps[6], and a mid-market engineering team typically juggles seven monitoring tools[5]. Each tool switch eats into focus time - studies show it takes 23 minutes to regain deep concentration after a context switch[3]. If you're checking three dashboards during an incident, that's over an hour of lost productivity.
By listing your tools and their purposes, you can quickly spot inefficiencies.
List Your Tools for Uptime, Revenue, and Dependencies
Start by cataloging every tool you use for monitoring uptime, revenue, and dependencies. Here's what that might look like:
- Uptime monitoring: This could include your hosting provider's status dashboard (e.g., Vercel, Railway, Render), ping services, or custom health check scripts.
- Revenue tracking: Tools like the Stripe Dashboard, payment processor analytics, or even spreadsheets where you manually log monthly recurring revenue.
- Dependencies: GitHub's Dependabot alerts, npm audit reports, or third-party security scanners.
For each tool, document how often you check it, where its alerts go (email, Slack, Discord, or SMS), and what information it provides. You might uncover gaps - like monitoring uptime but neglecting to check if payment systems are operational.
"The observability industry has a dirty secret: most teams need 4-7 tools just to know if their app is working." - Jamie Mallers, OneUptime[5]
Pay close attention to third-party dependencies. Modern apps often rely on 15–20 third-party APIs[7], which are potential failure points. To get a clearer picture, categorize them by impact:
- Tier 1: Critical services (e.g., Stripe, Auth0) that directly affect revenue.
- Tier 2: Important but not immediately critical services (e.g., SendGrid, Twilio).
- Tier 3: Non-essential services (e.g., analytics)[2].
Overlooking Tier 1 dependencies can lead to dissatisfied customers and missed revenue opportunities.
Once you've mapped out your tools and identified any gaps, it’s time to weigh the efficiency of your current scattered setup against the potential of a unified dashboard.
Scattered vs. Unified Monitoring: A Comparison
Here’s how scattered tools stack up against a unified monitoring solution:
| Feature | Scattered Tools | Unified Dashboard |
|---|---|---|
| Context Switching | High - 23 minutes lost per check[3] | Low - everything visible at a glance |
| Setup Complexity | High - multiple integrations/API keys | Low - one platform, one API |
| Alerting | Fragmented across email, Slack, SMS[1] | Centralized, with correlated alerts[5] |
| Cost | Multiple subscriptions ($50K–$200K/year)[5] | Consolidated billing |
| Incident Response | 15–25 minutes lost per tool switch[5] | Shared context across all metrics |
| Visibility | No cross-project overview[1] | Single-pane view for all projects[1] |
Relying on scattered tools also means inconsistent alert severity. One tool might flag an issue as "critical", while another labels it a "warning", leading to alert fatigue and missed problems[1]. During an outage, you might end up manually checking 10–15 vendor status pages[7], often finding the root cause 30–60 minutes after the issue started[7]. By then, customers are already frustrated, and downtime could be costing your SaaS business an average of $5,600 per minute[9].
sbb-itb-5b9029c
How to Build a Unified Monitoring Dashboard
Bring all your essential metrics - uptime, revenue, and dependencies - into one centralized dashboard without overhauling your existing infrastructure.
Step 1: Connect Uptime Monitoring
Start by linking your deployment platforms like Vercel, Netlify, or Railway using their status APIs or webhooks. Create a /health endpoint that returns a 200 status code after checking the internal connectivity of critical services like your database or Redis [4].
For third-party services, use a status page aggregator to track API statuses in one place [7]. Set up monitoring intervals based on importance: check essential services like payment processors every 1–5 minutes, while less critical ones, such as analytics, can be monitored every 15–30 minutes [9].
Once your uptime data is in place, it’s time to integrate financial metrics.
Step 2: Connect Revenue Tracking
Integrate your Stripe account to pull real-time financial data, including Monthly Recurring Revenue (MRR), Annual Recurring Revenue (ARR), churn rate, and net revenue [10]. This lets you view your business performance alongside technical data, eliminating the need to juggle multiple platforms. Most dashboards offer OAuth connections to Stripe, making the setup quick and straightforward.
After syncing operational and financial data, focus on securing your dependencies.
Step 3: Add Dependency and Vulnerability Scanning
Sync your GitHub repository to scan configuration files like package.json, requirements.txt, or go.mod for outdated dependencies and security vulnerabilities. This is crucial since modern apps often rely on 15–20 third-party APIs [7]. Set up workflows to prioritize alerts: send critical issues to Slack for immediate action and compile lower-priority updates into daily email digests. This way, you stay on top of security without drowning in notifications.
Step 4: Combine Everything Into One Dashboard
With uptime, revenue, and dependency tracking set up, bring all the data together in a single dashboard. This eliminates the need for constant context-switching and simplifies incident management. Use tools that automatically detect multiple services to consolidate your metrics.
To keep things organized, use consistent resource labels (like project_id) to group metrics accurately. If you’re managing multiple projects, designate one "scoping project" to aggregate data from all other projects, giving you a complete view of your operations at a glance.
Tools for Unified SaaS Monitoring
There are plenty of tools aimed at SaaS monitoring, but finding one that seamlessly combines uptime, revenue, and dependency tracking remains elusive. For instance, KPIStack integrates platforms like Stripe, Firebase, and GA4 [10]; IndieBar pulls essential financial data straight into your macOS menu; and Logdash merges logs, metrics, and uptime tracking with an AI-powered setup [11].
While these tools solve specific problems, they often leave gaps. Most developers still need to juggle multiple services to cover all their bases - uptime, revenue, dependencies - resulting in a tangle of dashboards, logins, and constant context-switching [1]. This scattered approach highlights the demand for a truly unified monitoring solution.
Why Bax Works Well for Indie Developers
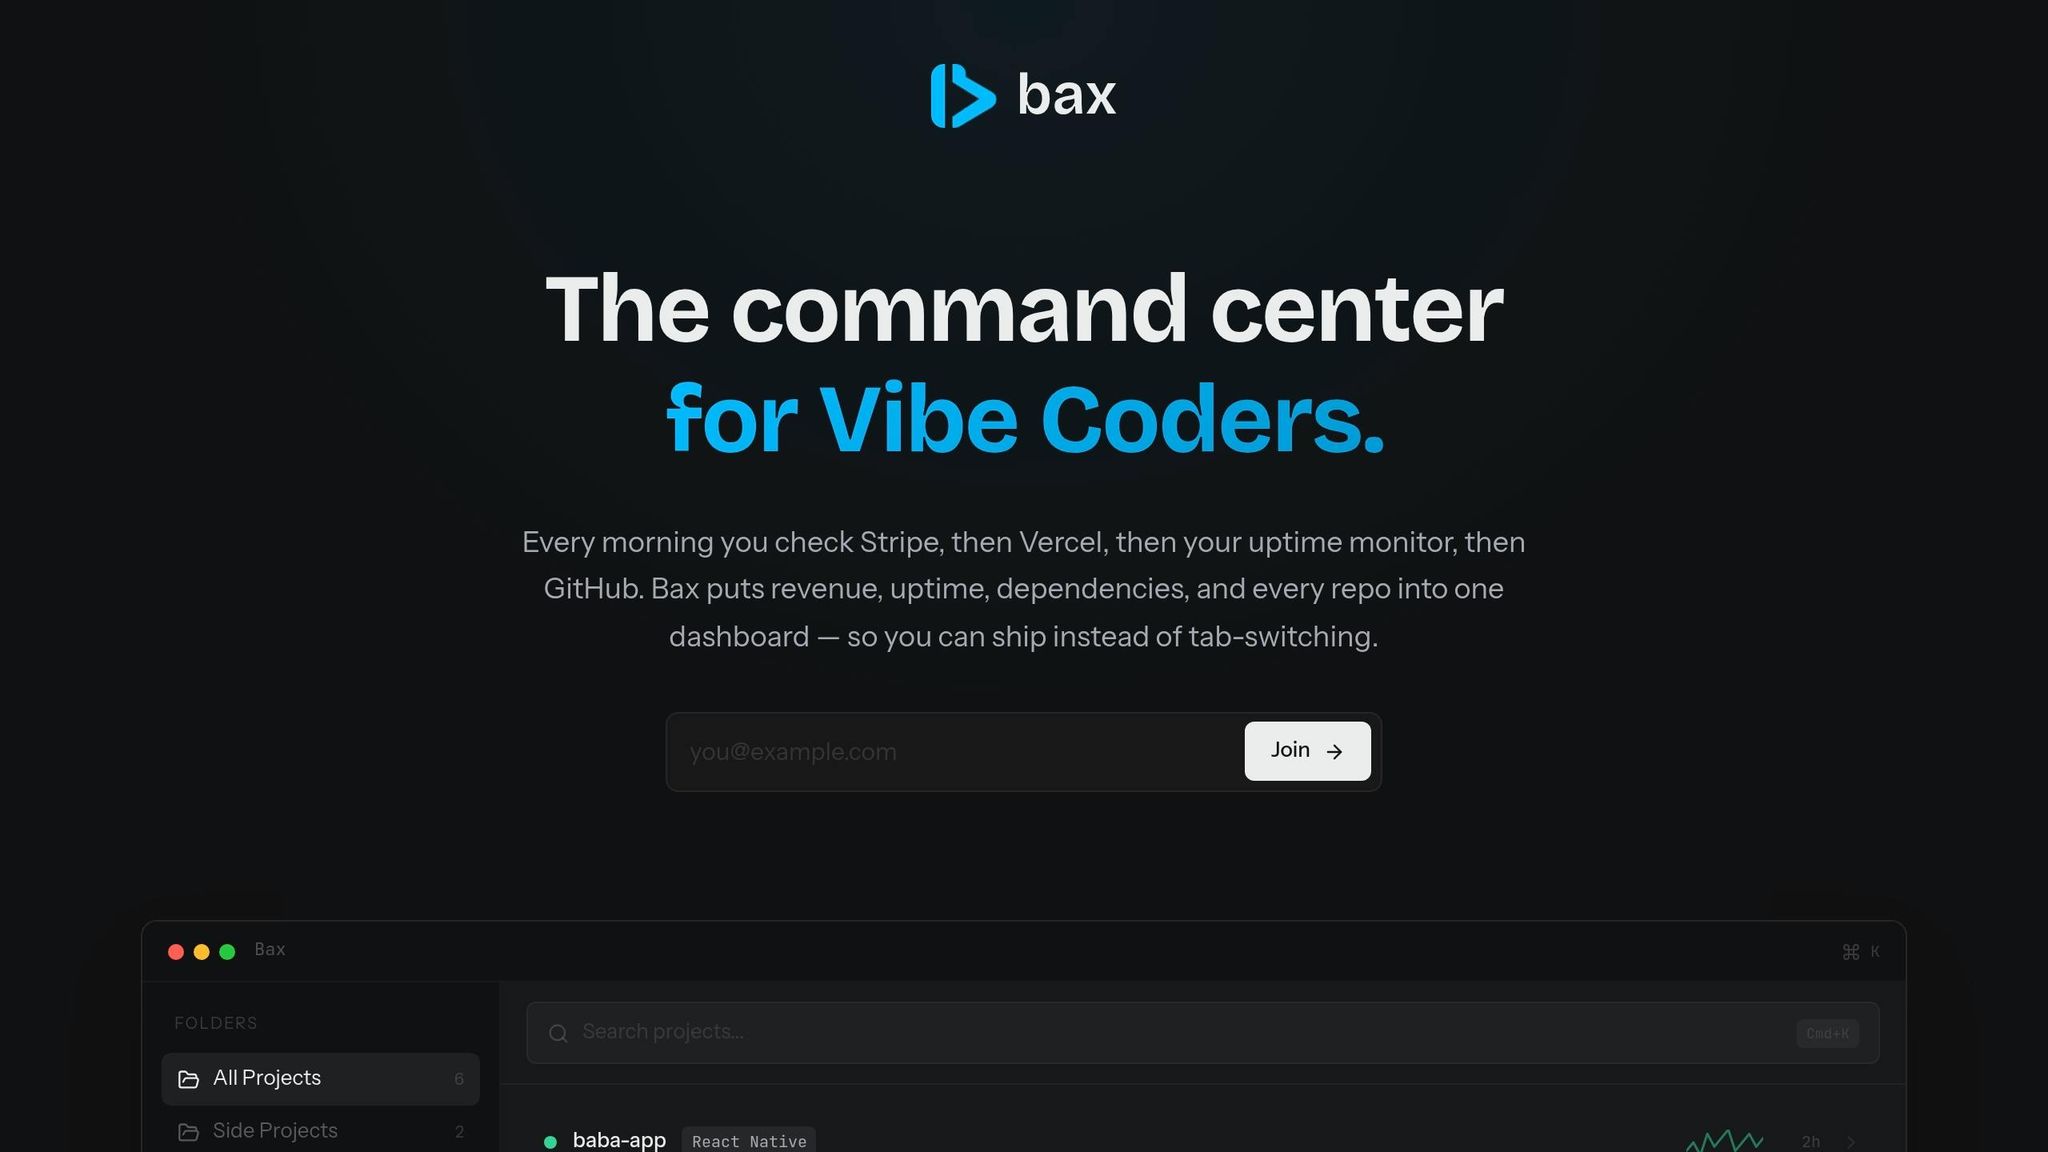
Bax steps in to tackle these exact challenges. Built with indie developers in mind, it eliminates the hassle of managing fragmented dashboards by offering an all-in-one solution. Bax integrates directly with GitHub, Stripe, and popular deployment platforms, giving you a central hub for monitoring everything that matters.
Here’s what Bax brings to the table:
- GitHub Integration: Manage repositories and scan dependencies effortlessly.
- Stripe Integration: Track key metrics like MRR, ARR, and churn in real time.
- Deployment Monitoring: Keep tabs on uptime with support for platforms like Vercel, Netlify, and Railway.
What’s even better? Bax automatically detects services from your codebase, so there’s no need for tedious manual setup. The command palette (Cmd+K) makes switching between projects a breeze, while one-click editor integrations with tools like Cursor, VS Code, Zed, and Windsurf keep your workflow smooth. Plus, AI-powered repository analysis flags technical debt and generates documentation, all within the same dashboard. To top it off, weekly email digests keep you updated without overwhelming you with notifications [1].
Bax Plans and Pricing Comparison
| Plan | Price | Projects | AI Analyses | Uptime Endpoints | Key Features |
|---|---|---|---|---|---|
| Free | $0 | 5 | 3/month | 2 | Health badges, developer news feed |
| Pro | $12.99/month | 25 | 25/month | 10 | Stripe revenue dashboard, dependency scanning, digest emails |
| Ultra | $19.99/month | Unlimited | Unlimited | 20 | Advanced dependency scanning, priority support |
| Enterprise | $500/month | Unlimited | Unlimited | 20 | SSO/SAML, dedicated support, custom integrations |
For indie developers juggling multiple side projects, the Pro plan hits the sweet spot with its robust features and affordable pricing. If you’re managing a larger portfolio or need fewer restrictions, the Ultra plan gives you unlimited project support. Meanwhile, the Enterprise plan caters to teams, offering advanced options like SSO and custom onboarding for a more tailored experience.
Optimize Your Workflow to Ship Faster
How to Reduce Context-Switching
Context switching is a productivity killer. Studies indicate it takes about 23 minutes to regain full focus after just one interruption [13]. For indie developers juggling multiple SaaS projects, those lost minutes can quickly snowball.
What’s the fix? Streamline your monitoring into one dashboard and prioritize notifications by urgency. Set up your system so that critical alerts - like payment failures - are sent directly to Slack or SMS for immediate attention. Meanwhile, less urgent updates, such as maintenance logs, can be bundled into a weekly email digest [1]. This way, you’ll only be interrupted when it’s absolutely essential.
Weekly digests are especially effective for projects in maintenance mode. Instead of wasting 15–30 minutes each morning manually checking for updates [1], you’ll get a consolidated summary, freeing up your time for actual development work. This approach not only prevents alert fatigue but also keeps your focus on what matters most: shipping new features.
"Productivity isn't about how many dashboards you can open. It's about how few you actually need." - Somadina, Technical Writer [13]
By optimizing your notifications, you’ll create the foundation for integrating AI tools that can further speed up your workflow.
Use AI for Smarter Project Management
Once interruptions are minimized, AI tools can take your project management to the next level. These solutions uncover insights that often get lost when multitasking. For instance, Bax’s AI-powered repository analysis flags technical debt, updates documentation, and identifies outdated dependencies - all directly from your dashboard. This eliminates the need for manual audits and ensures no project is overlooked.
AI also simplifies navigation. Tools like Bax let you open repositories in editors like Cursor, VS Code, Zed, or Windsurf with just one click. Pair this with a command palette (Cmd+K) for instant project switching, and you’re moving between tasks in seconds instead of minutes. This seamless integration with a unified dashboard keeps your workflow smooth and efficient.
A great example of this in action comes from February 2026, when developer Chace Medeiros implemented a "Two-AI Workflow." Using Cursor for code writing and Claude Code for reviewing, Medeiros managed eight active projects simultaneously. By layering custom setups with MCP servers like mcp-xcode-server, he reduced context-switching and sped up feature development. Automated code reviews even caught subtle bugs, such as memory leaks in SwiftUI [12].
The secret to this streamlined approach? Relying on fewer tools. When uptime monitoring, revenue tracking, and dependency scanning are all centralized, you spend less time searching for information and more time building the next big thing.
Conclusion
Unified dashboards simplify the way you monitor uptime, revenue, and dependencies, making SaaS project management far more efficient.
Say goodbye to juggling multiple tabs and tools. Bringing all your monitoring needs - uptime, revenue, and dependencies - into one dashboard clears up mental clutter, letting you focus on building the features that matter most.
When you lack unified visibility, debugging issues like external API failures can become a massive time sink. A single dashboard offers the clarity you need to quickly identify whether a revenue dip is caused by an external service outage (like a Stripe issue) or an internal bug [8].
Centralized monitoring reduces context switching, keeping your workflow smooth and organized. The result? Faster development and fewer operational headaches.
"Every bit of mental energy you save on operations is energy you can spend on building." - Monitrics Team [1]
Tools like Bax take this concept further by consolidating GitHub, Stripe, uptime, and dependency monitoring into one clean interface. Whether you’re managing 5 projects or 25, the aim is the same: spend less time firefighting and more time innovating.
This streamlined approach ensures your projects stay nimble, giving you the freedom to focus on what truly counts - creating exceptional software.
FAQs
What should my unified dashboard show first?
Your dashboard should spotlight the key metrics that matter most for evaluating your SaaS project’s performance. Prioritize tracking Monthly Recurring Revenue (MRR), Daily Active Users (DAU), churn rate, and uptime status. These metrics offer a quick snapshot of your financial health, user activity, and system stability, enabling you to make swift, well-informed decisions.
How often should I check uptime and third-party APIs?
It’s a good idea to monitor uptime and third-party APIs every 5 minutes. This strikes a balance between quickly spotting issues and managing resources efficiently. A 5-minute interval is enough to catch outages early and minimize their effect on users. For critical services, you might opt for more frequent checks - like every 1-2 minutes - if the situation demands it. Still, the 5-minute standard works well for most cases, keeping monitoring effective without overwhelming you with alerts.
How do I avoid alert fatigue with one dashboard?
To cut down on alert fatigue, bring essential metrics - like uptime, dependencies, and revenue - together in one centralized dashboard. Implement threshold-based alerts to weed out non-critical notifications, ensuring only important issues grab your attention. Additionally, group related alerts to streamline notifications and reduce unnecessary noise. By emphasizing major incidents with clear visual indicators and prioritization, you can stay focused on what matters most, tackling critical problems efficiently without feeling swamped.


