
Why Every SaaS Founder Should Track MRR Next to Deploy Status
Tracking Monthly Recurring Revenue (MRR) alongside deployment status in one dashboard can save time, reduce errors, and improve decision-making for SaaS founders. Here's why it matters:
- MRR is your business's financial pulse: It shows predictable income, customer retention, and revenue trends.
- Deploy status reflects product health: It highlights stability, updates, and potential issues like broken webhooks or billing failures.
- Combining these metrics reveals insights: For example, revenue dips after a deploy might indicate a technical issue, while growth after a feature release shows customer satisfaction.
- Fragmented tools waste time: Switching between Stripe, GitHub, and Vercel delays problem detection and disrupts workflows.
- Unified dashboards solve this: Tools like Bax bring financial and technical data together, enabling faster, more accurate responses to issues.
By linking MRR and deploy data, you can quickly connect technical decisions to business outcomes, helping you act faster and smarter.
Key Benefits:
- Spot revenue-impacting issues in real-time.
- Save hours spent manually reconciling data.
- Improve product stability and revenue growth.
The solution? Integrate Stripe, GitHub, and Vercel into a single dashboard, automate alerts for changes, and review metrics weekly to stay ahead of problems.
The Problem: Scattered Dashboards and Lost Time
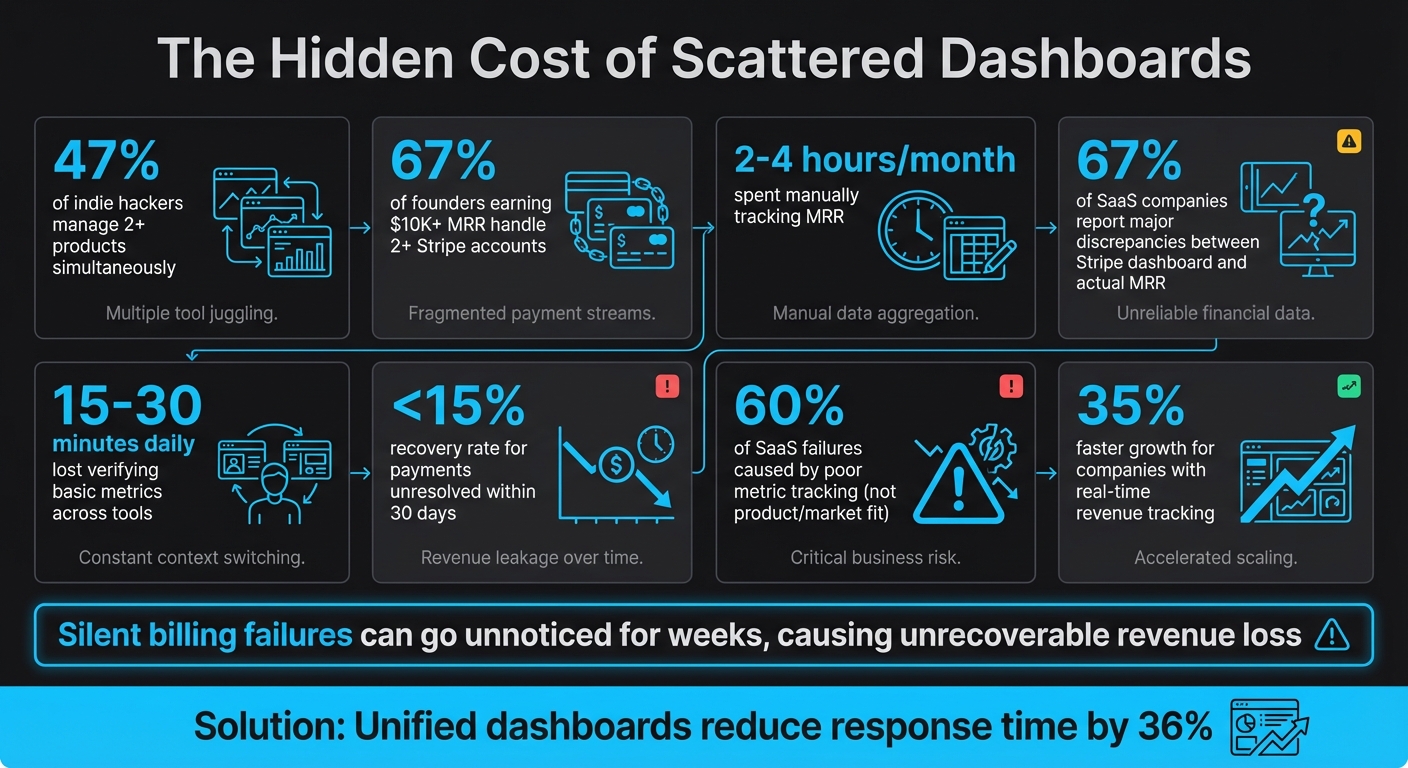
The Cost of Scattered SaaS Dashboards: Key Statistics on Time Waste and Revenue Loss
Too Many Tools, Not Enough Clarity
Running a SaaS business often feels like juggling multiple dashboards without ever seeing the full picture. Stripe tracks your revenue, GitHub monitors deploys, and Vercel oversees uptime. Each tool operates in isolation, leaving you with a fragmented view that makes it hard to connect the dots between technical issues and revenue fluctuations.
Here’s the reality: 47% of indie hackers manage two or more products at once [1], and 67% of those earning over $10,000 in MRR handle at least two separate Stripe accounts [4]. This setup creates blind spots. For example, a billing webhook failure won’t show up in your deployment logs, and a broken payment integration after a deploy will only surface as declining revenue - not the root technical issue. The result? You’re stuck manually piecing together what went wrong, often discovering problems far too late.
"Billing is not infrastructure. It is revenue execution. You don't set it and forget it. You monitor it like sales, churn, or pricing." - Abhishek, Founder [3]
For founders managing multiple Stripe accounts, the inefficiencies pile up quickly. On average, they spend 2 to 4 hours every month just tracking MRR manually [4]. Even worse, 67% of SaaS companies report major discrepancies between their Stripe dashboard and actual MRR [5]. So, not only is this process time-consuming, but it’s often inaccurate. This siloed approach delays problem detection and disrupts your workflow.
How Context-Switching Kills Productivity
Switching between dashboards isn’t just tedious - it’s a productivity killer. Imagine spotting a revenue dip in Stripe, then jumping to GitHub to see if a recent deploy caused it. Each switch takes 10–15 minutes to cross-reference data. Do this a few times a day, and you’re losing 15 to 30 minutes daily just verifying basic metrics [9].
The bigger issue? Missed alerts. Notifications are scattered across email, Slack, and app dashboards. A critical payment failure might get buried in a muted Slack channel, while a minor deploy warning grabs your attention with a phone ping. Some tools even require multiple clicks just to find the latest build status [10]. These delays aren’t just inconvenient - they’re costly.
Payments unresolved within 30 days have less than a 15% recovery rate [3]. If a billing issue occurs Monday morning but goes unnoticed until Tuesday because you were busy checking another dashboard, you’ve already lost precious time. Silent failures, like misconfigured webhooks or API outages, don’t raise obvious alarms. Instead, they show up as subtle revenue “drift” that might only get noticed weeks later during manual data comparisons.
This scattered approach wastes time, risks missed alerts, and creates inefficiencies that demand a unified solution to bridge the gap between deploys and revenue.
sbb-itb-5b9029c
Why MRR and Deploy Status Belong Together
Combining MRR with deploy status addresses the inefficiencies caused by scattered dashboards and constant context-switching, providing immediate insights you can act on.
MRR: The Pulse of Your SaaS Business
MRR (Monthly Recurring Revenue) is the core metric for any SaaS company. It represents predictable income, offering clarity on revenue trends, customer retention, and overall financial health. Unlike irregular sales, MRR gives you a steady view of monthly earnings, making it essential for forecasting, budgeting, and long-term planning.
"MRR is the heartbeat of a SaaS business. It provides a predictable revenue baseline, allowing for accurate financial forecasting, strategic decision-making, and efficient growth tracking." - Jason Berwanger, EVP of Finance/Data [11]
MRR is made up of several components: New MRR (from new customers), Expansion MRR (upgrades or add-ons), Contraction MRR (downgrades), and Churn MRR (lost customers). Each piece tells a story about your product's performance. For example, Expansion MRR is a strong indicator of customer satisfaction and product value [12]. When customers choose to spend more, it’s a sign your product is meeting or exceeding their expectations.
Deploy Status: The Health Check for Your Product
Deploy status reveals how stable your product is, how often updates are shipped, and how smoothly new features are implemented. It provides a real-time snapshot of product health. Beyond simple "pass" or "fail" build messages, deploy status involves monitoring webhook functionality, API uptime, and critical billing processes like invoice.payment_failed.
The challenge? Technical issues don’t always announce themselves. A misconfigured webhook during deployment might not crash your app, but it can silently disrupt billing. For example, customers might appear active in your system without actually being charged [3]. These "silent" failures can lead to unnoticed revenue leaks.
Having a clear view of deploy health ensures you catch these issues early, safeguarding both product performance and revenue.
Connecting Deploys to Revenue Patterns
When technical performance and financial metrics are aligned, you can see how product updates directly affect revenue. For instance:
- A revenue dip after a deploy might point to a broken payment integration.
- A surge in Expansion MRR after a feature release could show that customers value the update.
- A spike in churn MRR following a major product change might reveal disruptions in user workflows.
Companies with real-time revenue tracking grow 35% faster than those relying on monthly reconciliations [7]. Imagine a pricing page update causing a sharp rise in Contraction MRR. With real-time visibility, you can address the issue immediately instead of waiting until the end of the month.
For example, if a Monday deploy breaks your billing webhook and you only discover the problem weeks later, the lost revenue may be unrecoverable. By correlating technical events with revenue changes in real time, you can shift from reacting to problems to preventing them. This proactive approach helps you maintain product stability while driving consistent revenue growth.
How to Track MRR and Deploys Together
Bringing your technical and financial data together is a game-changer for gaining actionable insights. Here's how you can make this integration work.
Put Revenue and Deploy Data in One Place
A common hurdle in tracking Monthly Recurring Revenue (MRR) alongside deploys is data silos. Your revenue might be in Stripe, while deployment logs sit in GitHub or Vercel. Constantly switching between these platforms is inefficient.
The fix? Combine these data streams into a unified dashboard. You can use webhooks to pull real-time updates from Stripe (like customer.subscription.updated, invoice.paid, and invoice.payment_failed events) alongside deployment data from your hosting platform [1][14]. With an event-driven setup like this, data latency can drop to as little as 15 minutes [13].
Storing this information in a time-series database (like TimescaleDB or InfluxDB) allows you to compare MRR trends with deployment timelines seamlessly [14]. If you're managing multiple Stripe accounts (which applies to 67% of indie hackers earning over $10,000 MRR), normalize revenue into a single currency and convert annual plans to monthly equivalents (divide yearly pricing by 12) for accurate tracking [1][4].
"SaaS firms automating these data flows cut incident response times by 36%, helping technical teams focus on product improvements rather than manual data reconciliation."
If building a custom solution feels daunting, tools like Bax can integrate Stripe revenue tracking with GitHub and Vercel deployment logs into one dashboard. This eliminates the need to jump between platforms and keeps your data streamlined.
This consolidated approach not only simplifies your workflow but also enables you to monitor your metrics proactively.
Set Up Alerts for Revenue Changes After Deploys
Silent failures - errors that don’t crash your app but disrupt billing - can be especially harmful. For instance, a broken webhook during deployment might stop payment processing. Payments left unresolved for 30 days are rarely recovered [3].
Set up real-time alerts to catch MRR changes after deploys. For example, you could configure Slack or Telegram notifications if MRR drops by 10% or if no webhook events are detected during a specific timeframe [4][16]. Additionally, create a health check endpoint (e.g., /api/webhooks/stripe/health) to verify that both your database and webhook handler are functioning. Monitor this endpoint every 1–5 minutes to ensure your billing system stays operational during and after deployments [16]. To avoid duplicate revenue entries during retries, use idempotency keys like Stripe event IDs for webhook processing [15].
With these safeguards in place, you can confidently monitor how deployments impact revenue.
Track How Specific Releases Affect Revenue
To understand which updates drive growth - or cause churn - you need cohort analysis by release date. Group customers based on their signup date relative to a deployment, then compare retention and MRR trends before and after the release [17].
Leverage Stripe's metadata fields to tag customers or subscriptions with specific release versions during checkout. This enables you to track how different customer groups respond over time, helping you identify whether a new feature led to Expansion MRR (upgrades) or Contraction MRR (downgrades) [7][18].
Establish a weekly review routine - many founders choose Monday mornings - to analyze the previous week’s MRR changes against your deployment schedule [1]. This can reveal valuable insights: Did conversions spike after a pricing page update? Did churn increase following a UI redesign? Companies with real-time revenue tracking grow 35% faster than those relying on monthly reconciliation [7].
Tools for Unified MRR and Deploy Tracking
Unified tools bring together revenue and deployment data, offering a single, actionable view to help you understand how your product changes impact your business.
Stripe for Revenue Tracking

Stripe provides built-in analytics for metrics like MRR, ARR, churn, and net revenue [19]. With its Explore feature, you can dig deeper into events like customer churn or subscription upgrades [20]. It even lets you customize how discounts - whether one-time or recurring - factor into your MRR calculations, giving you more precise reporting [20].
Stripe is designed for speed, with query latency under 300 milliseconds in production. This responsiveness allows businesses to quickly identify emerging trends [13][21].
"To stay nimble, [businesses] need to be able to spot new patterns of customer behavior just as they emerge - something that's only possible when high-quality billing data is available in real time."
GitHub and Vercel for Deployment Monitoring
Platforms like GitHub and Vercel provide the technical insights you need to track deployments. They offer features like deployment logs, commit histories, and build statuses, helping you understand what code was shipped, when, and with what result. While these tools excel at monitoring technical changes, they don't tie those changes directly to business outcomes. That’s where a unified dashboard comes in.
Bax: One Dashboard for Revenue and Deploys
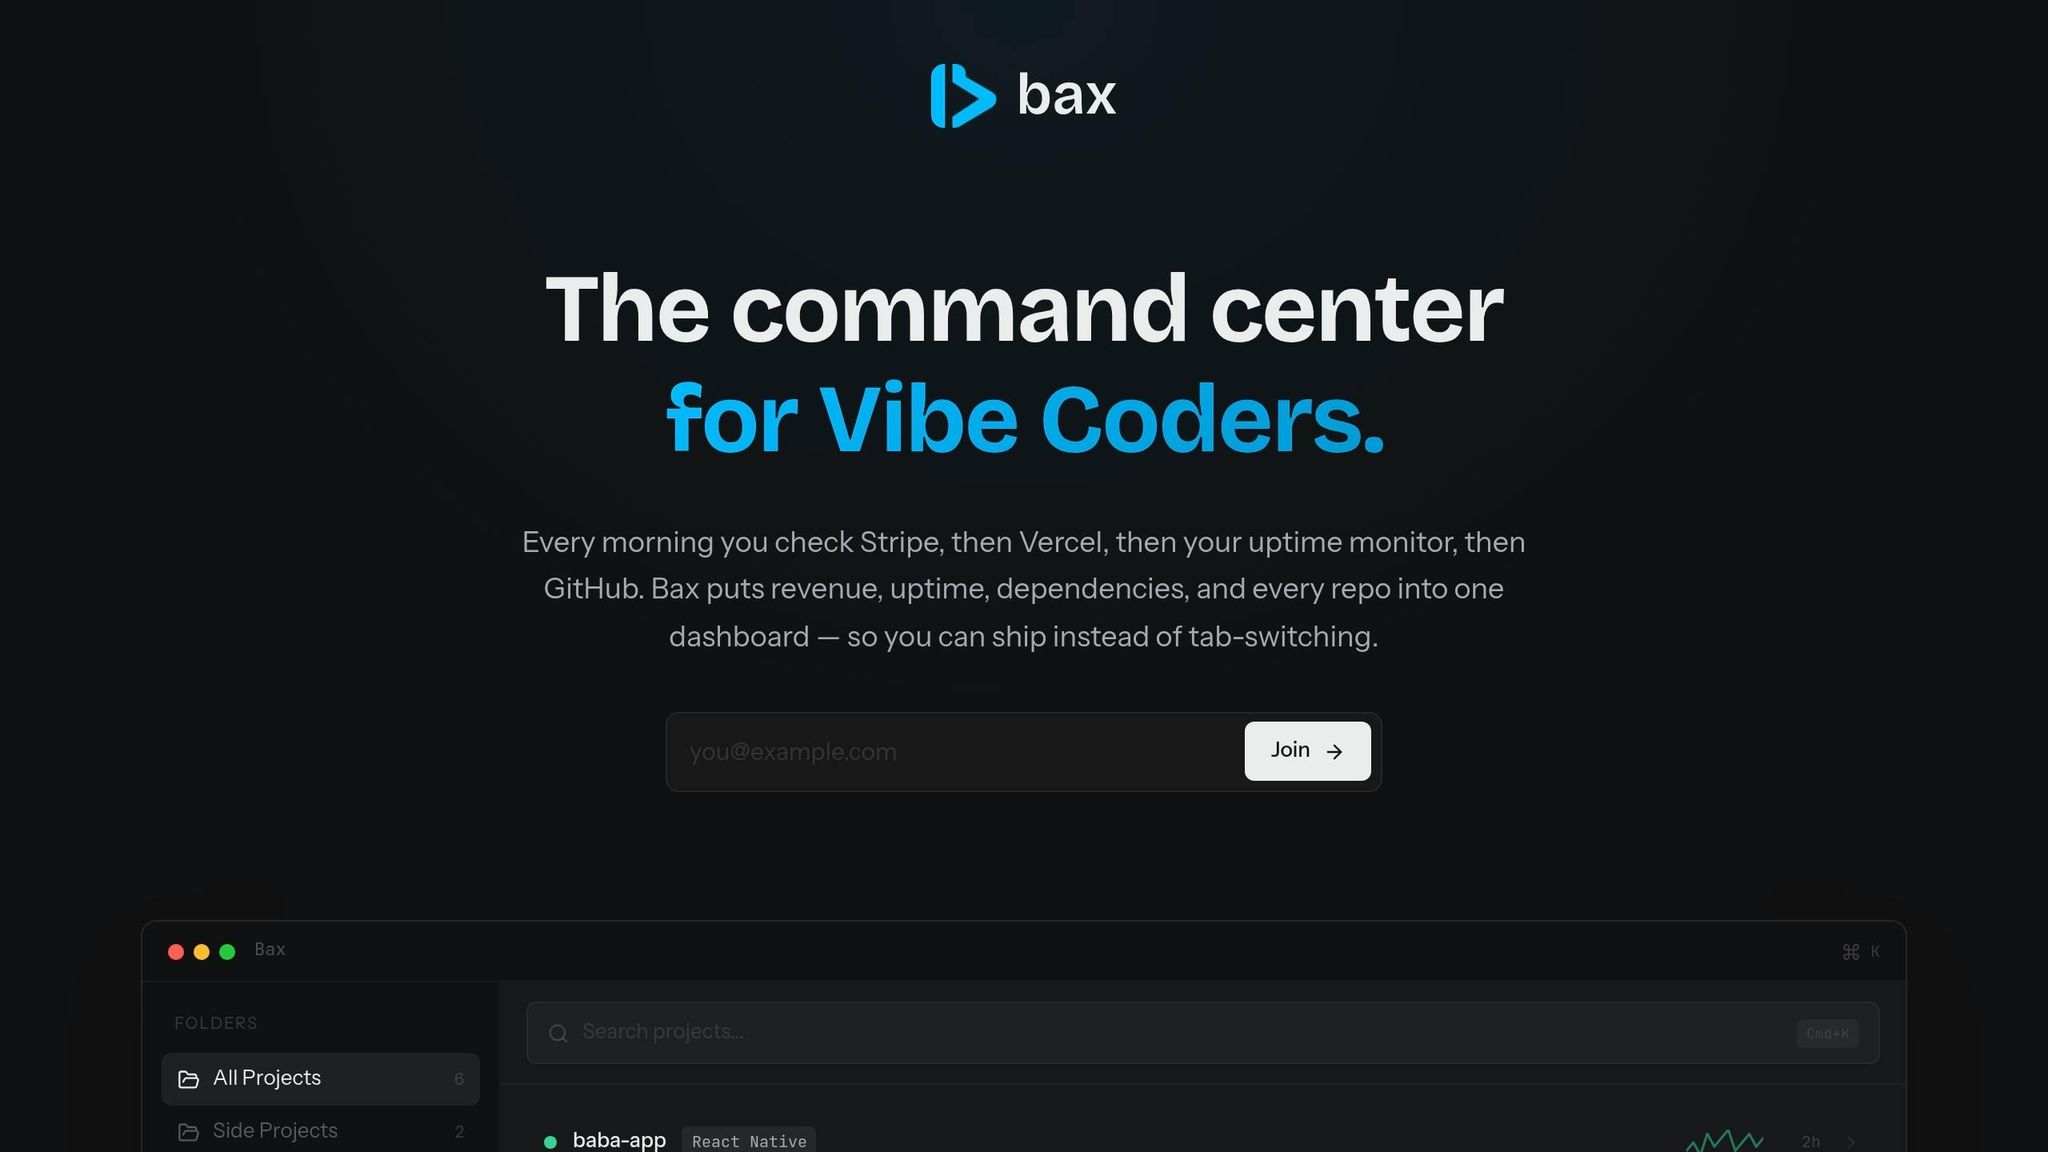
Bax simplifies monitoring by combining Stripe's revenue data with deployment logs from platforms like GitHub and Vercel into one centralized dashboard. Instead of jumping between multiple tools to piece together the full picture, Bax gives you a clear view of how each deployment affects your business performance.
For indie developers, Bax offers two subscription tiers:
- Pro plan: $12.99/month, includes Stripe revenue tracking, dependency monitoring, and 10 uptime monitors across up to 25 projects.
- Ultra plan: $19.99/month, removes project limits and adds unlimited AI-driven repo insights.
Steps to Start Tracking MRR and Deploys Together
Step 1: Link Your Revenue and Deploy Tools
Start by connecting your revenue platform, like Stripe, with your deployment tools. For instance, if you're using Vercel, you can run the command vercel integration add stripe in your terminal. This automatically injects the necessary environment variables - STRIPE_SECRET_KEY and NEXT_PUBLIC_STRIPE_PUBLISHABLE_KEY - into your project, sparing you from manual setup. This step is critical because 19% of security breaches stem from mismanaged API keys [14][23].
Once connected, configure Stripe webhooks to send real-time payment updates, such as invoice.paid or customer.subscription.deleted, directly to your backend or dashboard [14][1]. To ensure security, always verify webhook signatures using the STRIPE_WEBHOOK_SECRET key to avoid spoofed events [14][1]. On the deployment side, set up GitHub Actions to ping a /health endpoint after each deploy. This creates a feedback loop, linking code changes to system performance [22].
With these tools synced, you’re ready to integrate this data into a central dashboard.
Step 2: Create or Use a Unified Dashboard
Once your revenue and deploy tools are securely connected, it’s time to bring everything together in a single dashboard. Building a custom dashboard from scratch can take anywhere from 40 to 120+ hours, translating to an opportunity cost of over $12,000 for many indie founders [1][14]. Instead, consider using a purpose-built tool that syncs your data every 15 to 30 minutes. Daily syncs can leave you vulnerable to critical blind spots, especially around churn or billing failures [1].
When integrating tools, use OAuth for secure, read-only access instead of sharing full credentials [4]. Focus your dashboard on tracking Net New MRR (New + Expansion - Churned), as gross revenue figures can be misleading due to one-time charges [1][6]. Add intelligent alerts for key events, like a sudden 10% drop in MRR or churn rates spiking 50% above normal [1][4].
By consolidating this data, you eliminate the inefficiencies caused by fragmented dashboards and constant context switching.
Step 3: Review Your Dashboard Weekly and Take Action
With your dashboard up and running, regular analysis becomes the priority. Set aside 40 to 50 minutes each week - ideally on Sunday or Monday morning - for a focused review session [6]. While real-time alerts will notify you of urgent issues like failed payments, these weekly reviews help uncover trends that might be missed in daily updates [1][4][6].
"Billing is not infrastructure. It is revenue execution. You don't set it and forget it. You monitor it like sales, churn, or pricing." - Abhishek Sanoria, Indie Hackers [3]
During these reviews, look for connections between deploys and revenue trends. For example, if your MRR consistently peaks during the third week of the month, consider scheduling major feature launches in the second week to optimize timing [6]. If your MRR doesn’t align with actual cash collected, investigate immediately - this could signal silent billing issues or misconfigured webhooks [3].
Conclusion: Better Metrics Lead to Better Decisions
Tracking Monthly Recurring Revenue (MRR) alongside deploy status transforms how you manage your SaaS business. Rather than juggling disconnected tools, you gain real-time insight into how product updates directly affect revenue. Imagine spotting a churn spike within hours of a deploy instead of discovering it weeks later - you can act immediately, potentially recovering 30–40% of failed payments [1].
This level of visibility leads to measurable improvements in efficiency. The numbers speak for themselves: 60% of SaaS failures are caused by poor metric tracking, not issues with the product or market fit [8]. By consolidating your financial and technical metrics, you not only eliminate the 2–4 hours per month wasted on manual spreadsheet updates [4], but you also gain predictive insights. These insights can flag retention risks 2–3 months before they impact your MRR [24].
As Alex Val, Founder of MultiMMR [24], explains: "MRR is your scoreboard, but the other metrics are your playbook. You need both to win." By integrating these metrics, the Quick Ratio becomes your guide: a score above 4.0 signals it’s time to scale aggressively, while anything below 2.0 highlights a need to address churn [2]. This approach helps you avoid unnecessary costs tied to an unstable product-market fit. Instead of constantly reacting to problems, you shift to proactive leadership, with a clear understanding of whether growth stems from new customers or product-driven expansion.
The solution is simple: connect your tools, unify your dashboard, and review your metrics weekly. Relying on multiple dashboards and missing key patterns only drains your time and revenue.
FAQs
What’s the fastest way to tell if a deploy caused an MRR drop?
To quickly determine if a deployment led to an MRR drop, compare the MRR figures from just before and after the deployment. Tools like real-time dashboards or analytics platforms - such as Stripe or custom-built dashboards - can help you track changes and pinpoint any revenue decline linked to the deploy.
Which Stripe webhook events matter most for reliable MRR tracking?
To keep your Monthly Recurring Revenue (MRR) tracking accurate, certain Stripe webhook events are absolutely essential. These include subscription-related events such as payment successes and failures, changes in subscription status, trial expirations, and customer authentication actions. Each of these events plays a direct role in shaping your recurring revenue and offers crucial insights into your billing operations.
How do I handle MRR across multiple Stripe accounts accurately?
To keep tabs on MRR across multiple Stripe accounts, automated tools or custom dashboards are your best bet. These solutions integrate data from all accounts, making tracking seamless. Using the Stripe API and webhooks (like invoice.paid or customer.subscription.deleted) allows you to automate updates in real time, cutting down on manual work.
It’s also important to address potential hiccups, such as timezone differences or billing errors. Regularly reconciling your data can help catch and fix these issues. By centralizing your metrics, you’ll make monitoring simpler and ensure greater accuracy.
